In my previous post on WebKit, I explained how we can debug the WebProcess using GDB. In this post, I am going to talk about another useful debugging tool that can be used to debug graphics: APItrace.
APITrace is a debugging tool for OpenGL and Direct3D programs. You can read more about it in its online documentation [1]. This post is about using APITrace to examine the OpenGL state of WebKit at a given time in order to detect the cause of a WebGL bug.
I am going to use the command line to generate a .trace file with debugging information and a UI frontend called qapitrace to examine the contents of this file. The frontent can be installed on Debian by running #
apt-get install apitrace-gui.
The issue:
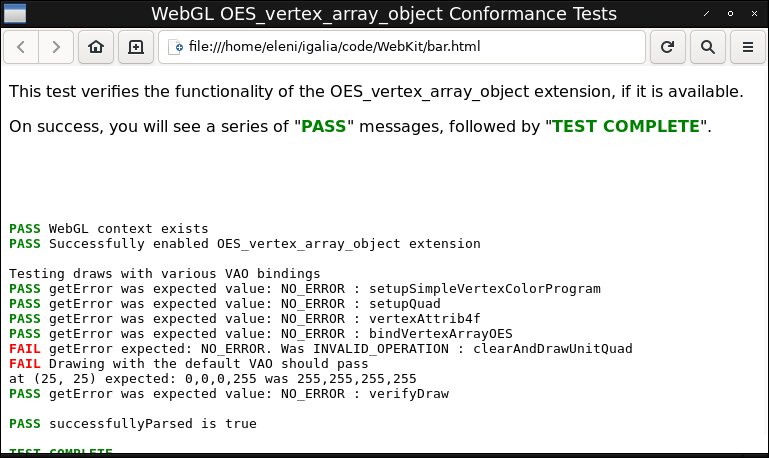
I’ve noticed that many WebGL tests that use VAOs generate an INVALID OPERATION ERROR when glDrawArrays is called and the default ( null) VAO is bound in WebGL. And so, I’ve written a minimal WebGL test that simply binds the default VAO and draws a quad calling glDrawArrays. Something like that:
|
1 2 3 4 5 6 |
[...] setupQuad(1, true); gl.vertexAttrib4f(colorLocation, 0.5, 0.5, 0.5, 1); ext.bindVertexArrayOES(null); verifyDraw("with the default VAO", 1, true); [...] |
In the snippet above, function verifyDraw calls the function clearAndDrawUnitQuad that calls gl.drawArrays inside.
The test result is something like that:
By examining the calls with GDB we can see that after parsing the Javascript, WebGL gl.drawArrays call is translated into OpenGL’s glDrawArrays. So, as a first step, I’d need to figure out in which cases calling glDrawArrays would generate an OpenGL error.
According to the OpenGL spec, a GL_INVALID_OPERATION error is generated by glDrawArrays in the following two cases:
- GL_INVALID_OPERATION is generated if a non-zero buffer object name is bound to an enabled array and the buffer object’s data store is currently mapped.
- GL_INVALID_OPERATION is generated if a geometry shader is active and mode is incompatible with the input primitive type of the geometry shader in the currently installed program object.
And so, as a next step, we could check if a geometry shader is active at the time that glDrawArrays is called, or if a buffer object is bound and its data store is currently mapped.
Using APITrace to examine the problem
First, I am going to use APITrace to detect the call that generates the error, and examine the whole OpenGL state at the time that this call takes place.
This is how to do it:
As we’ve seen in my previous post on debugging WebKit with GDB, the WebGL implementation is part of the WebKit WebProcess. So, we’d rather attach APITrace to the WebProcess instead of MiniBrowser.
To detect the running WebProcess:
We can start the MiniBrowser from our build directory:
|
1 |
./build/bin/MiniBrowser bar.html |
and find the WebProcess using ps :
|
1 2 3 |
ps aux | grep -i webproc eleni 4570 0.2 0.2 86247496 209280 pts/0 SLl+ 13:33 0:09 /home/eleni/igalia/install/libexec/webkit2gtk-4.0/WebKitWebProcess 8 20 |
It seems that ps returned the following process:
/home/eleni/igalia/install/libexec/webkit2gtk-4.0/WebKitWebProcess.
Knowing the process id we can use APITrace as follows:
|
1 |
apitrace trace /home/eleni/igalia/install/libexec/webkit2gtk-4.0/WebKitWebProcess |
But we need to be inside the directory we were when we started the MiniBrowser and make sure that the environment variables we set to run WebKit/MiniBrowser are set!
For me that directory is my WebKit checkout directory (/home/eleni/igalia/code/WebKit) and I run MiniBrowser from there like that:
./build/bin/MiniBrowser bar.html (where bar.html is the WebGL test).
The command above creates a file
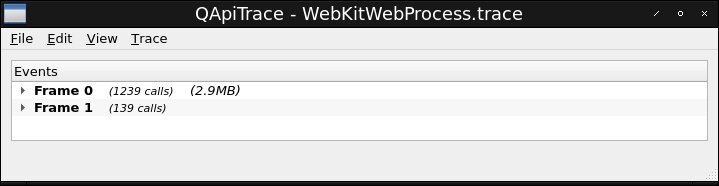
WebKitWebProcess.trace in the current directory. This file can be opened and examined using qapitrace:
qapitrace WebKitWebProcess.trace,
opens a window where we can examine the OpenGL calls of each frame:
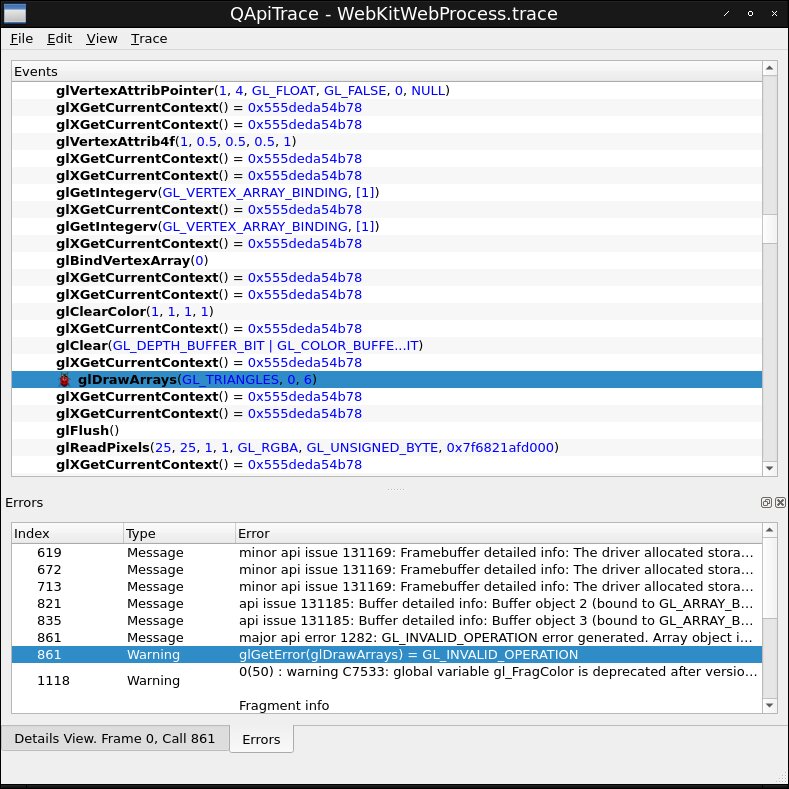
We can open a frame and see a list of draw calls. We want one of the many glDrawArrays but which one? Checking View->Show Errors Dock will make visible a dock with all errors.
Clicking the line: glGetError(glDrawArrays) = GL_INVALID_OPERATION will select the buggy
glDrawArrays , and will let us examine it:
Double click on the selected glDrawArrays will display a new dock where we can examine the OpenGL state. There, we can check if a geometry shader was active or a buffer attached to the VAO was mapped at the time that glDrawArrays was called.
Let’s first check the shaders that were used at the time:
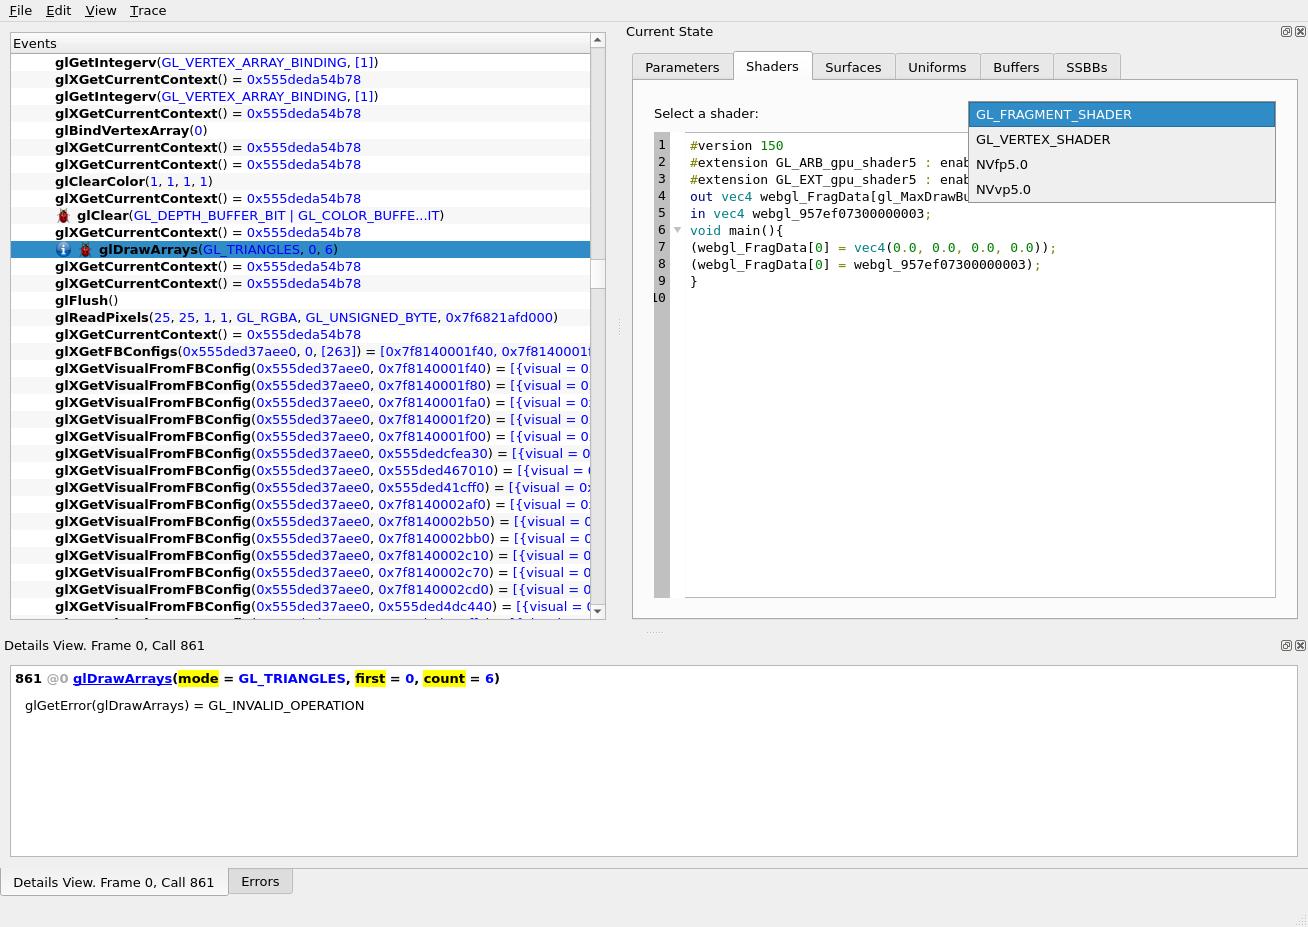
In the drop-down list we can see that the active shaders were: a vertex shader, a fragment shader, and two Nvidia specific shaders. There was no geometry shader.
Let’s check the buffers:
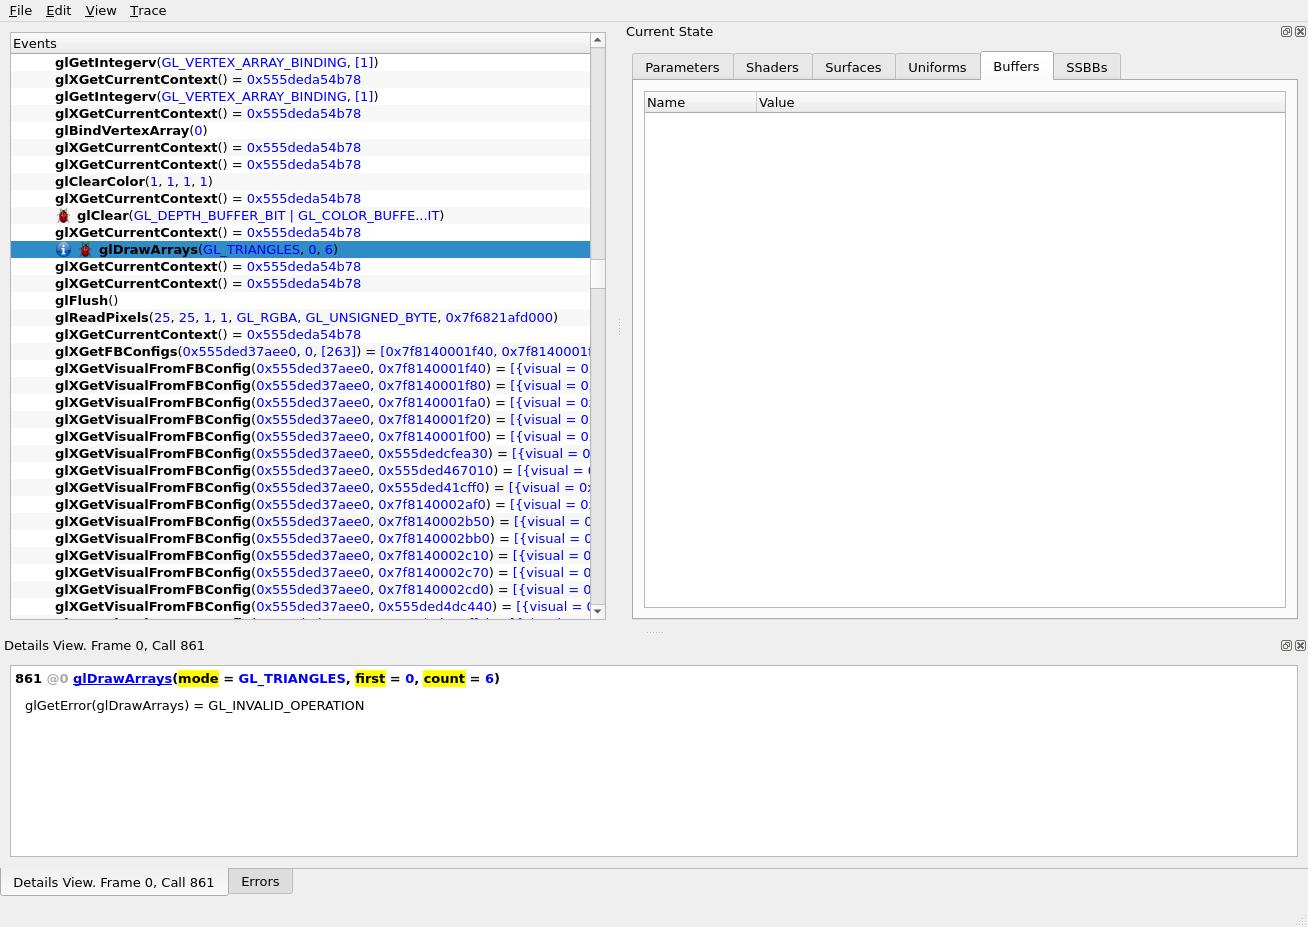
No buffers were found.
So, this is weird. None of the potential causes of GL_INVALID_OPERATION error is satisfied here but we are still getting the error!
Looking back at the error dock we can re-examine the messages for more information:
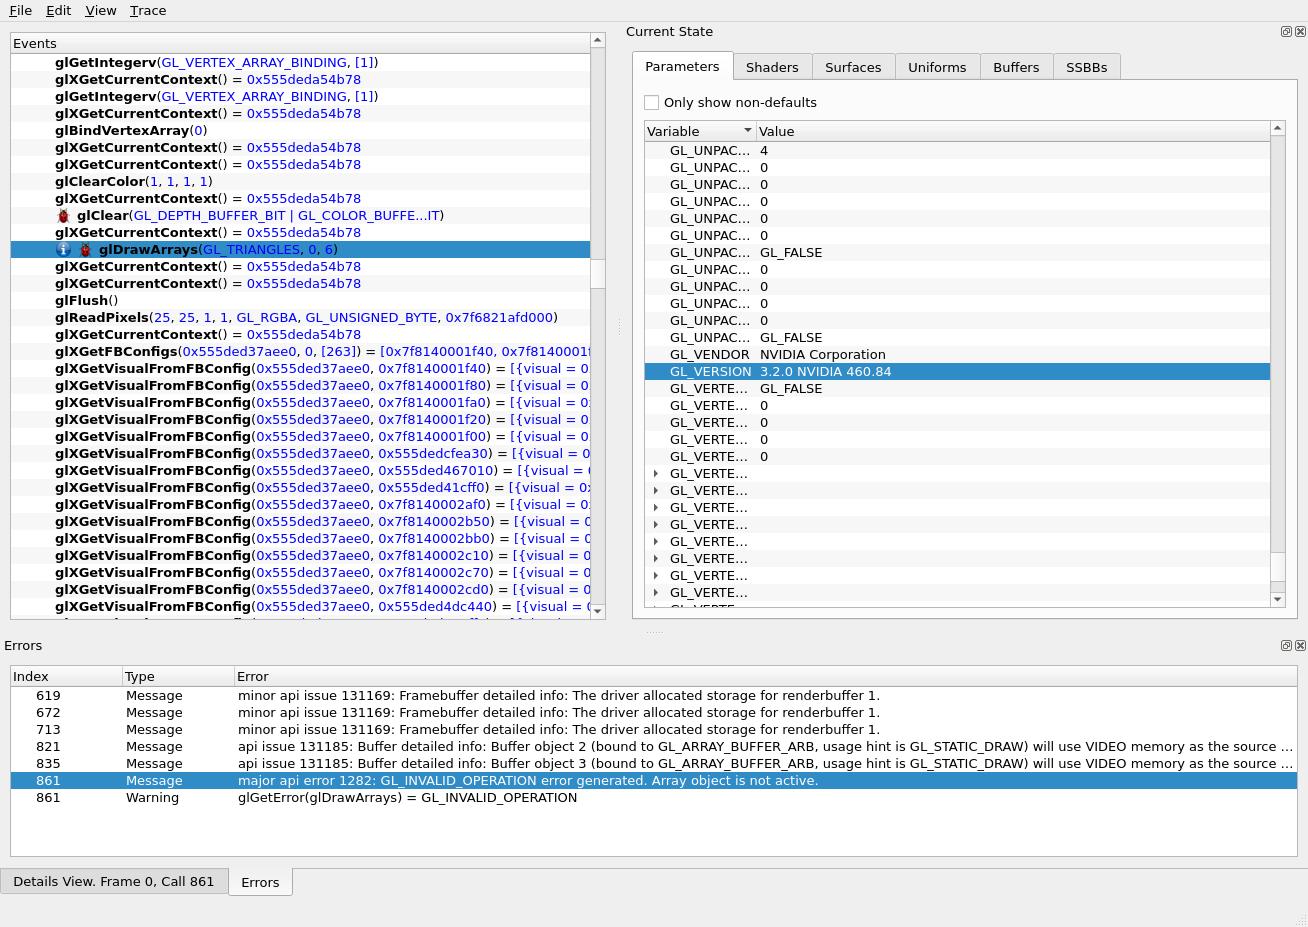
There’s this: array not active nessage that could be relevant to the problem. What could this mean?
One thing we can suspect by checking the version (GL_VERSION) in the parameters of the current state is that we run in a versioned OpenGL 3.x (probably for compatibility with GLESv2/3)! In OpenGL 3.x rendering without VAOs is not supported. We can’t simply bind a 0 (null) VAO in the implementation, we need to construct and store a default VAO which will be bound when no other VAOs are bound! This is what is done in our current WebGL implementation but is it done correctly? We need to make sure that we always bind the default VAO when no other VAO is active instead of calling internally something like
glBindVertexArray(0) for example.
Thanks to APITrace, we now have an idea on what to look at next. Further debugging and error fixing is beyond the scope of this post, and I don’t know if my suspicion is correct yet.
([Update:] Finally that suspicion was correct and the problem was fixed in WebKit.)
As APITrace gave me a first clue on what might be wrong in WebGL, and some ideas to continue, I decided to demonstrate how to use it as an extra debugging tool in big and complex graphics projects such as WebKit.
Links
[1]: APITrace documentation: https://apitrace.github.io/
[2]: WebKit: https://www.webkit.org
[3]: Previous post on debugging WebKit: An easy way to debug WebKit’s WebProcess with GDB
See you next time!